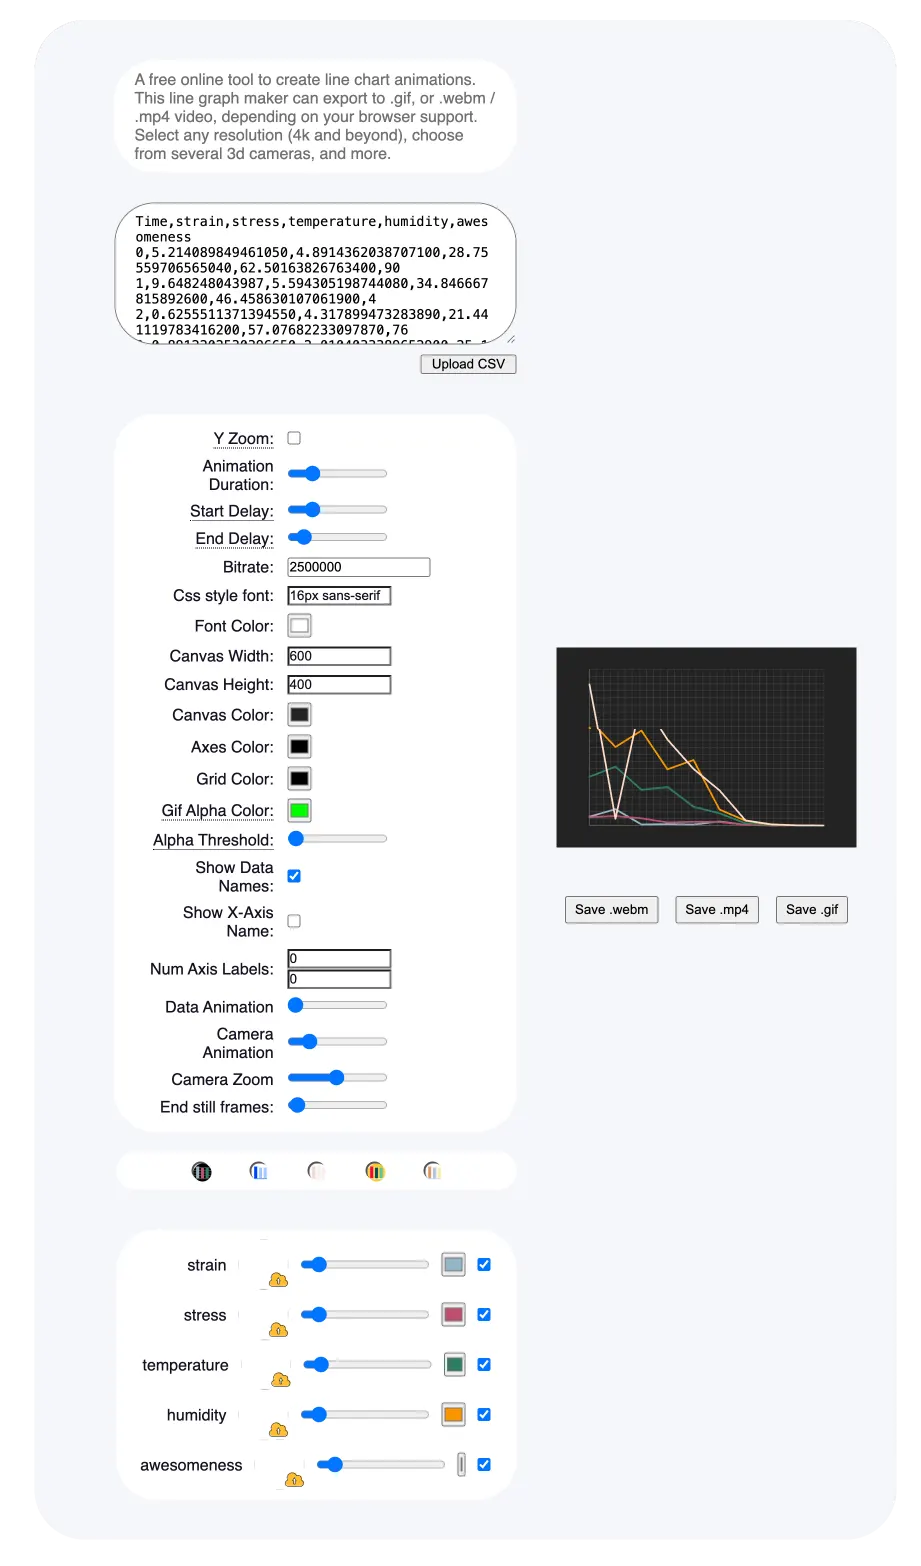
| 1 | Paste your data |
Paste rows from an excel spreadsheet. Or in excel, select File->Export and pick csv. Then use the csv upload button to select the file just exported. |
|
| 2 | Tweak the Animation |
Change any settings to your liking, noting the effect they have on the animation on the right. |
|
| 3 | Choose a Theme |
Instantly set all colors at once to a preset theme. |
|
| 4 | Select Images |
Select images to represent each series of data. These work especially well with data animation 2 (from step 2 above). Change the size of the images, if selected, and the color of the series. You can also toggle some series to be visible or not. |
|
| 5 | Export Video |
Choose a format to export to. Some browsers do not support some video formats, but yours should support either .webm or .mp4. Just try it out and see if there are any errors. From there you can include in a powerpoint presentation, or import into any video editor of your choice eg. after effects, premiere. |